

在電視媒體常常聽到分析師說,台指期正價差 未來行情看好,呈現逆價差趨勢轉空,理論上聽起來有道理 事實上不見得是如此
觀察台指期貨和現貨正逆價差的關係。到底是期貨跟著現貨跑,還是期貨領先現貨?用Multicharts 來回測驗證

SPD是自行設定的函數 用Data1期貨減去Data2現貨 ,當SPD大於0 也就是正價差 隔天買進多單,當SPD小於0 也就是逆價差 隔天買進空單
程式碼如下
SPD = close of data1 – close of data2;
if SPD> 0 then buy next bar at market;
if SPD< 0 then sellshort next bar at market;
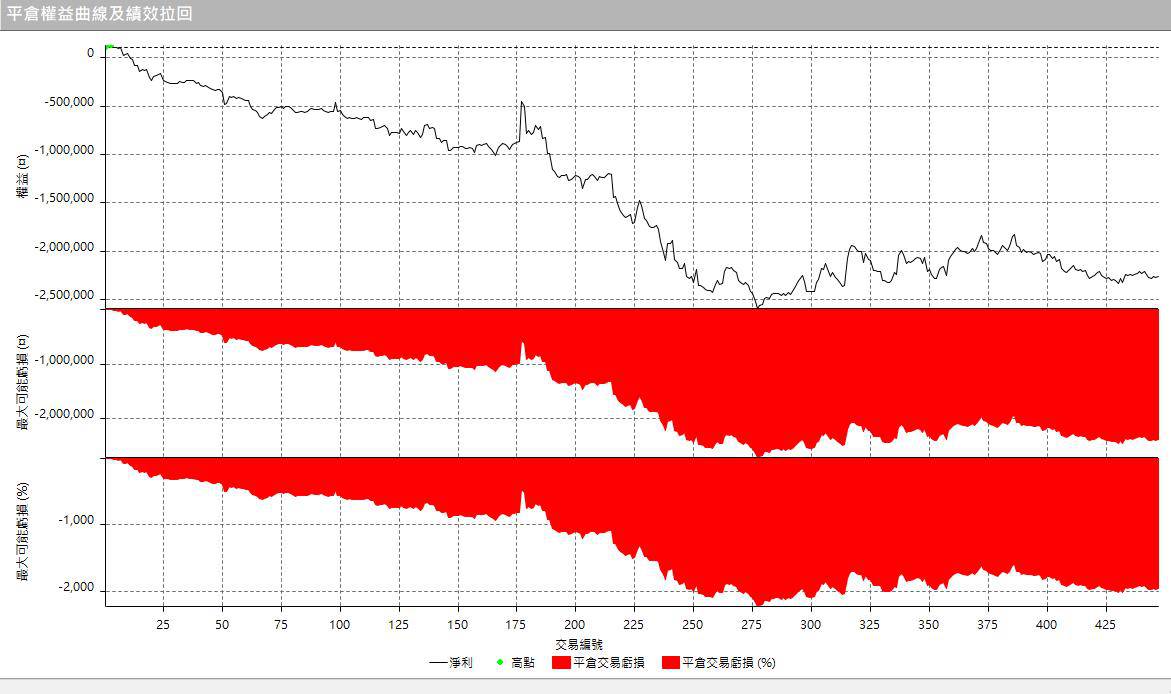
回測從2017~2023 日K線圖
績效看起來慘不忍睹 難道被老師騙了嗎??
我們反向思考 反之逆價差作多 正價差放空,這個思考的邏輯就是認為期貨和現貨指數到最後會收斂
if SPD < 0 then buy next bar at market;
if SPD > 0 then sellshort next bar at market;
加上停損停利 預設進場價格的 0.03%
if marketposition=1 then sell next bar at entryprice*(1-0.03) stop;
if marketposition=-1 then buytocover next bar at entryprice*(1+0.03) stop;
if marketposition=1 then sell next bar at entryprice*(1+0.03) limit;
if marketposition=-1 then buytocover next bar at entryprice*(1-0.03)limit;
別忘了台指期結算日要平倉
if marketposition<>0 and dayofweek(date)=3 and dayofmonth(date)>14 and dayofmonth(date)<22 then setexitonclose;
回測表竟然發現變成了正報酬。 雖然績效曲線仍然是起起伏伏 但至少這樣的思考方式比較正確
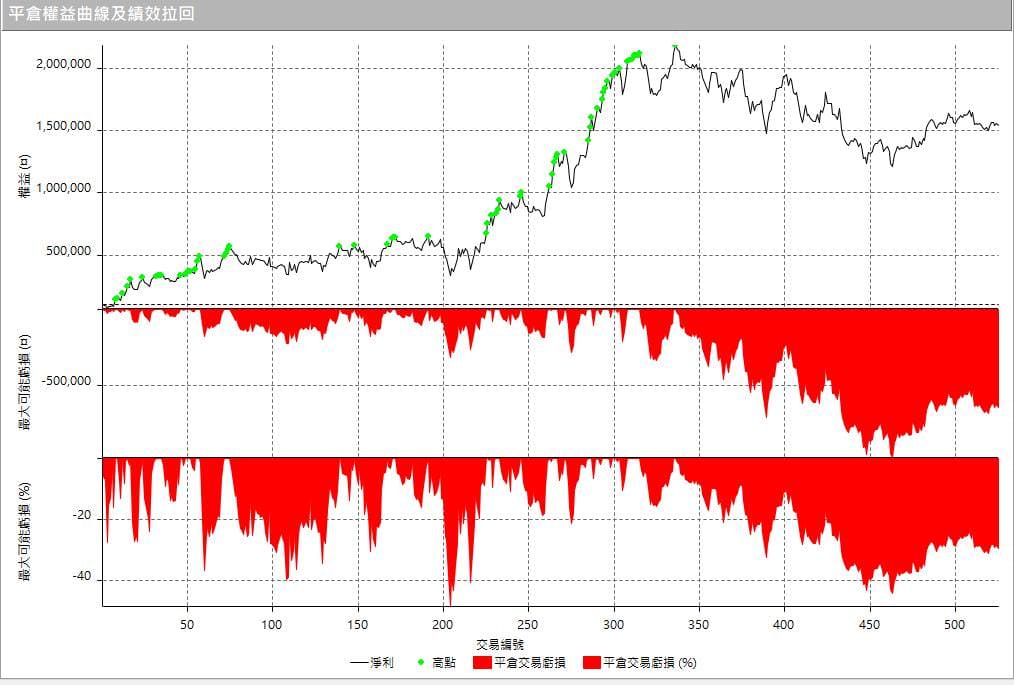
加入另外一個濾網, 必須在10日均線之上才能做多,在10日均線之下只做空
if SPD< 0 and c>Average(c,10) then buy next bar at market;
if SPD> 0 and c<Average(c,10) then sellshort next bar at market;
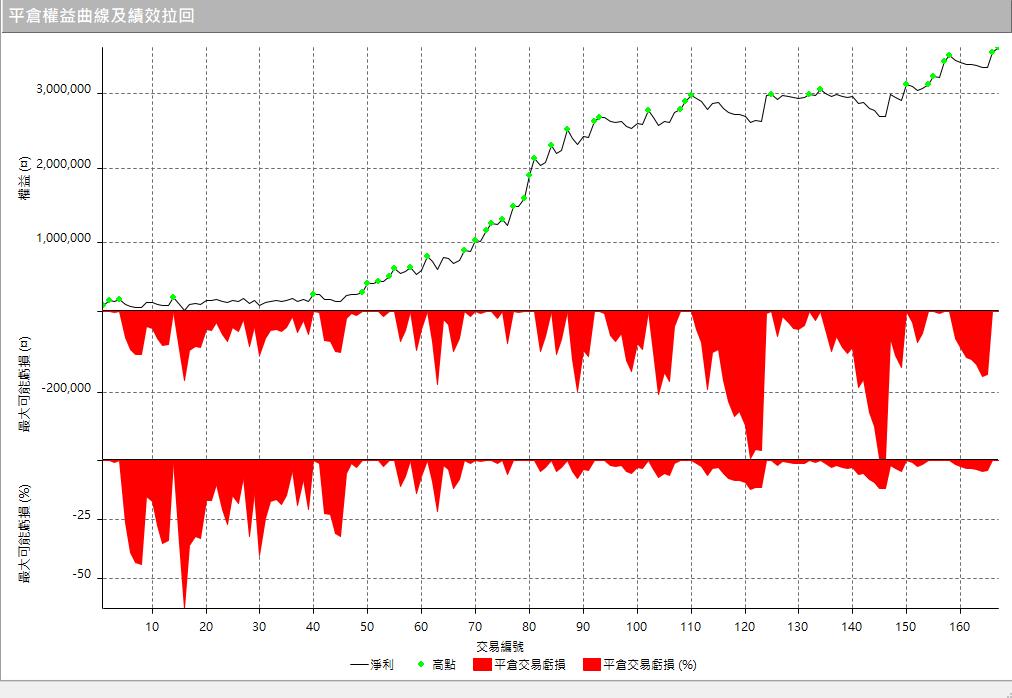
績效曲線看起來更加平滑,也比較接近可以上線的標準
回測近5年 1口台指期獲利240萬 最大虧損是45萬左右,平均年風報比 1.05
基本上台指期正逆價差是個可以使用的濾網,但是仍要小心服用
換個思考方式 我們不用正價差逆價差的絕對值,而是採用價差的平均值,這樣的好處是避免每年除權息旺季 台指期常常處於非常大的逆價差
另外 用前一天的收盤價加上一定的百分比突破進場做多或是跌破進場做空
if marketposition<>1 and SP<Average(SP,3) then buy next bar at C*(1+N) stop;
if marketposition<>-1 and SP>Average(SP,3) then sellshort next bar at C*(1–N) stop;
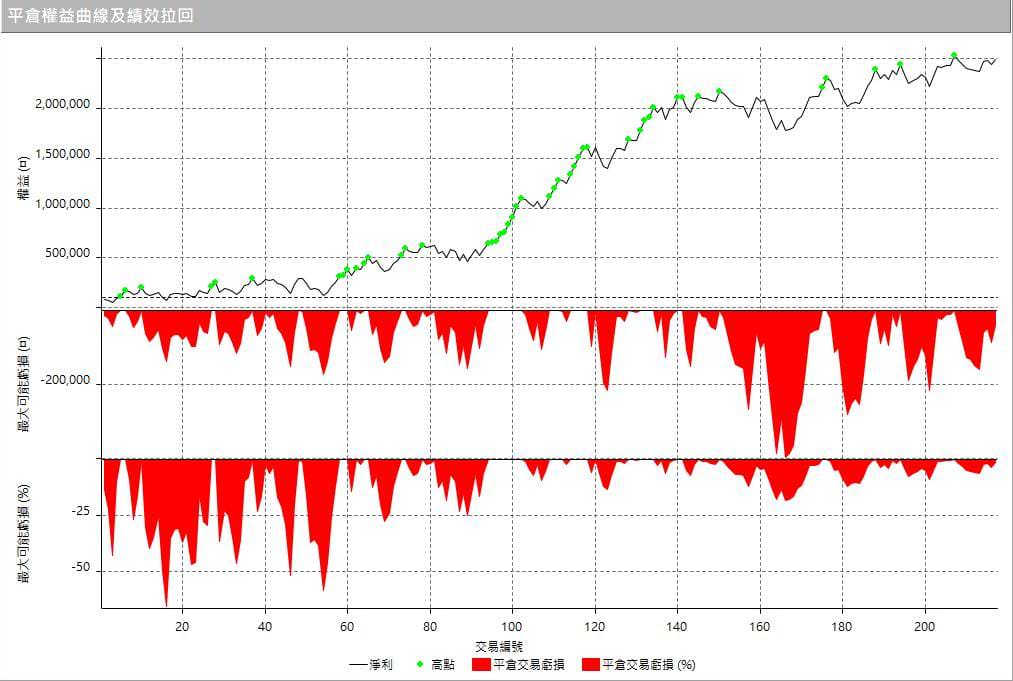
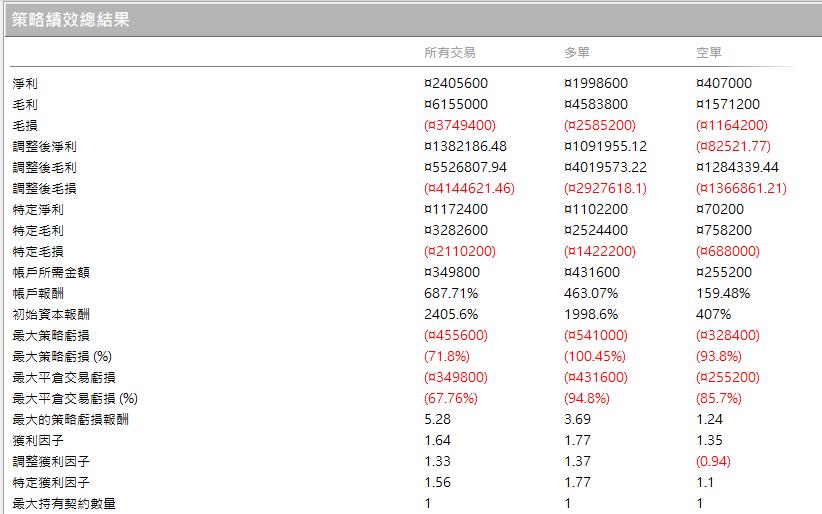
回測的績效表現依舊亮眼
回測2017-2023 總獲利351萬 最大虧損約41萬 平均年風報比1.2 ,但是缺點就是策略作多比較容易賺 做空的績效就是比較鳥

每年都保持一定的正報酬 穩定中成長

小提醒
- 使用Data2 的資料 記得把與歷史資料相吻合的地方取消
- MC的日K資料不完整 建議用300分鐘或是以分K組成
- 價差策略有可能發散大一段才收斂 實際交易上停損點的設定是必須的
或許你有更好的想法 歡迎和我分享,回測的績效不代表未來,但是至少可以驗證策略的可行性,不必要浪費真實的金錢換得寶貴教訓

![[Multicharts] 四個週期性的交易策略](https://cdn.aplus.trading/wp-content/uploads/2024/09/a-vividly-colored-infographic-illustrating-a-seaso-0EA6iwvqT2uEVQ9s14BhXw-zavRx16XSDGaqCJyfHR1ig-870x570.jpeg)
 By
By![[Multicharts]-HMA移動平均策略](https://cdn.aplus.trading/wp-content/uploads/2024/07/HMA_featured_1200-870x570.jpg)
![[Multicharts] 追蹤 Put/Call Ratio未平倉 的台指期交易策略](https://cdn.aplus.trading/wp-content/uploads/2024/05/putcall-870x570.jpg)
![[Multicharts] 三大法人未平倉交易策略](https://cdn.aplus.trading/wp-content/uploads/2024/01/street-photography-wall-street-bustling-with-three-individuals-gripping-loaves-of-bread-closely-sh-839077191-870x570.png)


艾大,我有一個期指操作的模型想法,簡略說明就是特定時間,瞬間大量追買或追賣,不知道您有興趣討論嗎?哈
艾大您好,想請教使用價差的平均值做進出場,我的回測結果和您的結果差距很大,以下是我的程式碼,
var: SPD(0);
inputs: N(0.01);
SPD = close of data1 – close of data2;
if mp1 and SPD < Average(SPD,3) then buy next bar at C*(1+N) stop;
if mp-1 and SPD > Average(SPD,3) then sellshort next bar at C*(1-N) stop;
// close position with 3% stoploss
if mp = 1 then sell next bar at entryprice*(1-0.03) stop;
if mp = -1 then buytocover next bar at entryprice*(1+0.03) stop;
// close position with 3% stopprofit
if mp = 1 then sell next bar at entryprice*(1+0.03) limit;
if mp = -1 then buytocover next bar at entryprice*(1-0.03) limit;
Condition99=dayofmonth(date) > 14 and dayofmonth(date) < 22 and dayofweek(date) = 3 ;
if mp 0 and Condition99 then setexitonclose;
能請您看一下是不是有寫錯的地方? 謝謝!
我用的時段是全日盤時段 data2放加權指數